 saasprokit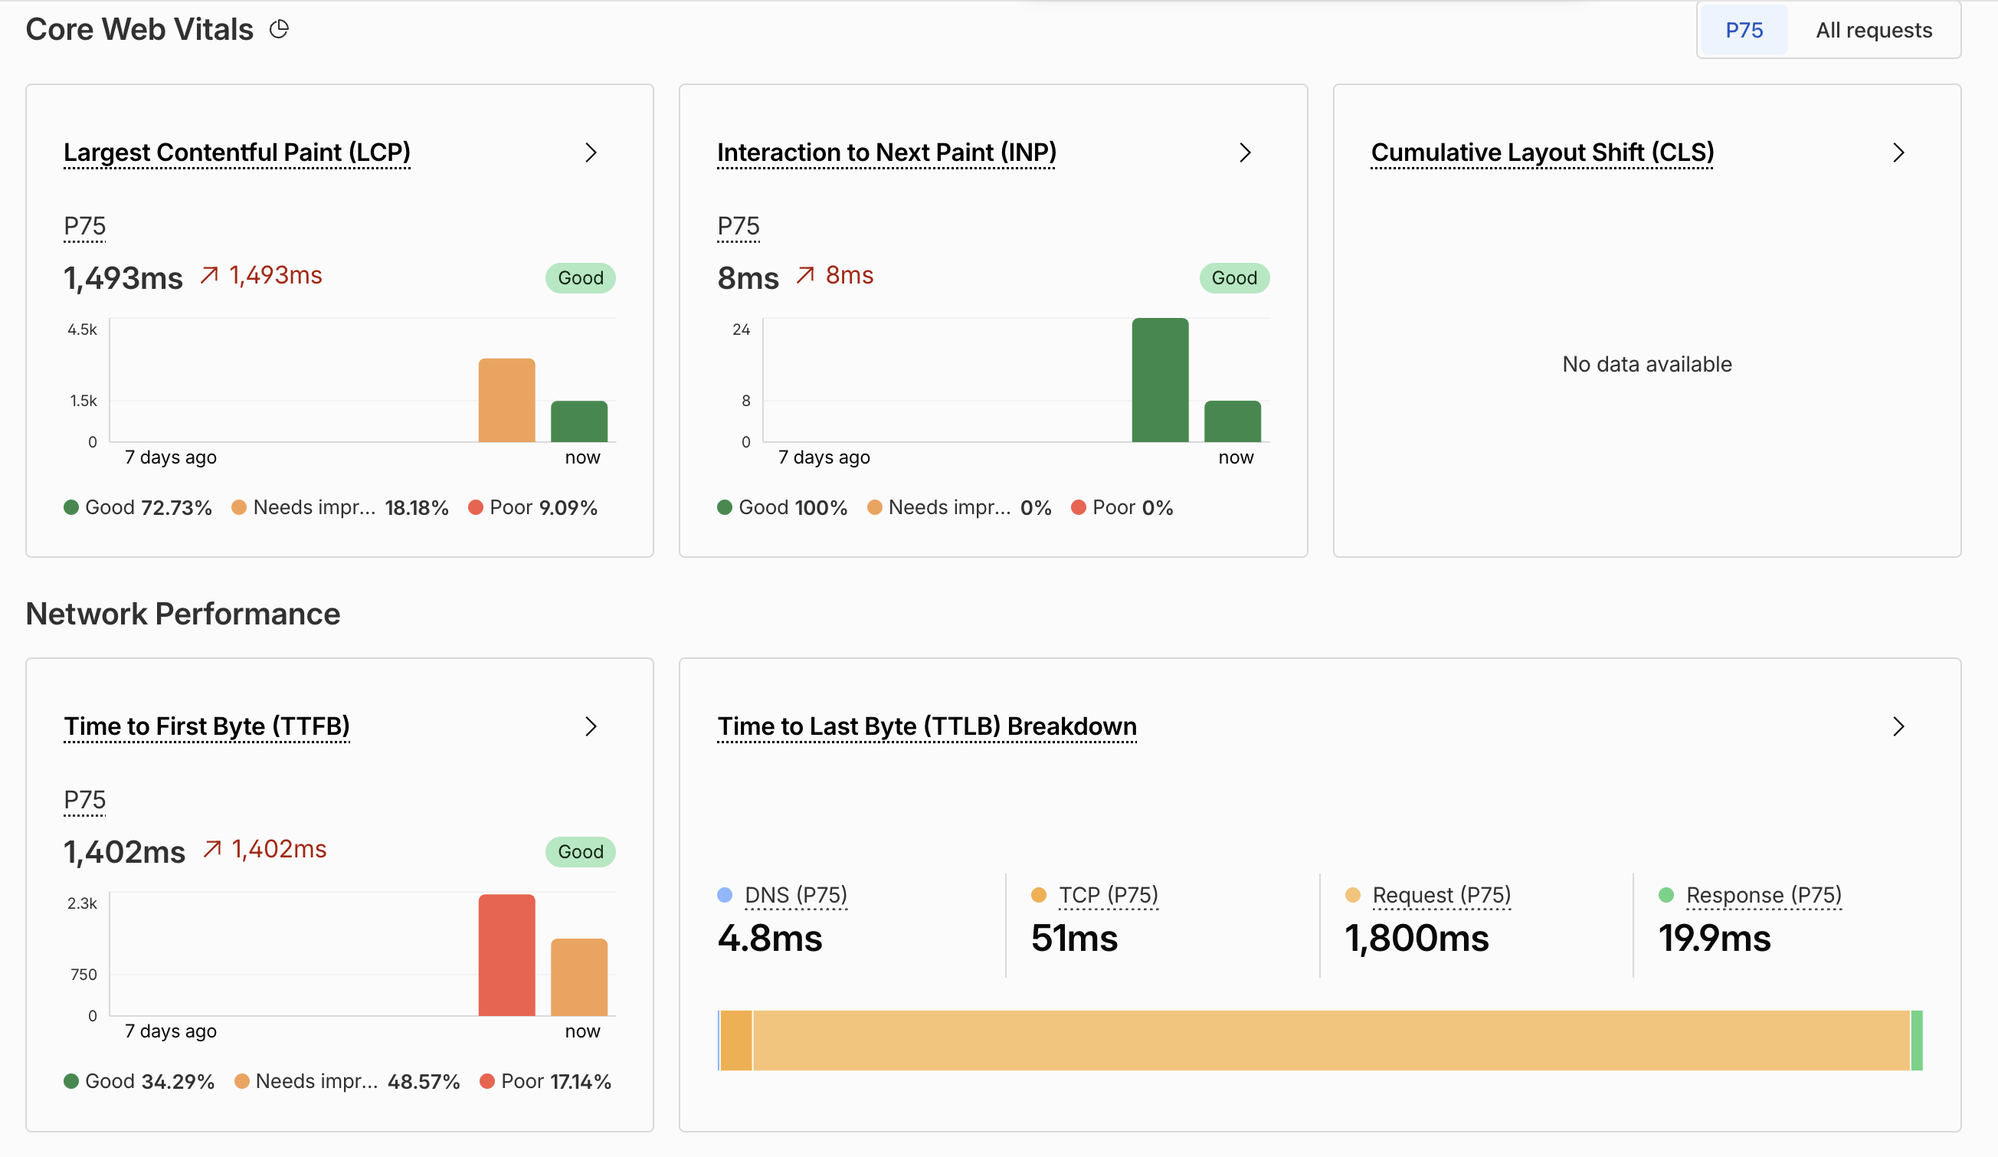
This site felt slow. Not broken, just that half-second of nothing that makes you check whether your wifi died. The dashboard above is Cloudflare's real user monitoring at that point, and it put numbers on the feeling.
Read the two big numbers together. LCP at the 75th percentile is 1,493ms and TTFB is 1,402ms, so the page paints 91ms after the first byte arrives. Almost the entire wait is the server thinking. The breakdown on the right agrees: DNS 5ms, TCP 51ms, response 20ms, and one fat orange bar labelled Request at 1,800ms.
So the question was never "how do I optimize my React". It was: what is my Worker doing for 1.8 seconds?
Measuring before theorizing
I did two things before touching code. First, curl with timing flags against
production, four times in a row: 1.08s, 0.27s, 1.06s, 1.07s to first byte.
Remember that odd fast one, it matters later.
Second, a throttled browser run, the kind of profile a mid-range phone on hotel wifi gets: 4x CPU slowdown, Slow 4G. Here is that waterfall, filtered down to the files that matter:
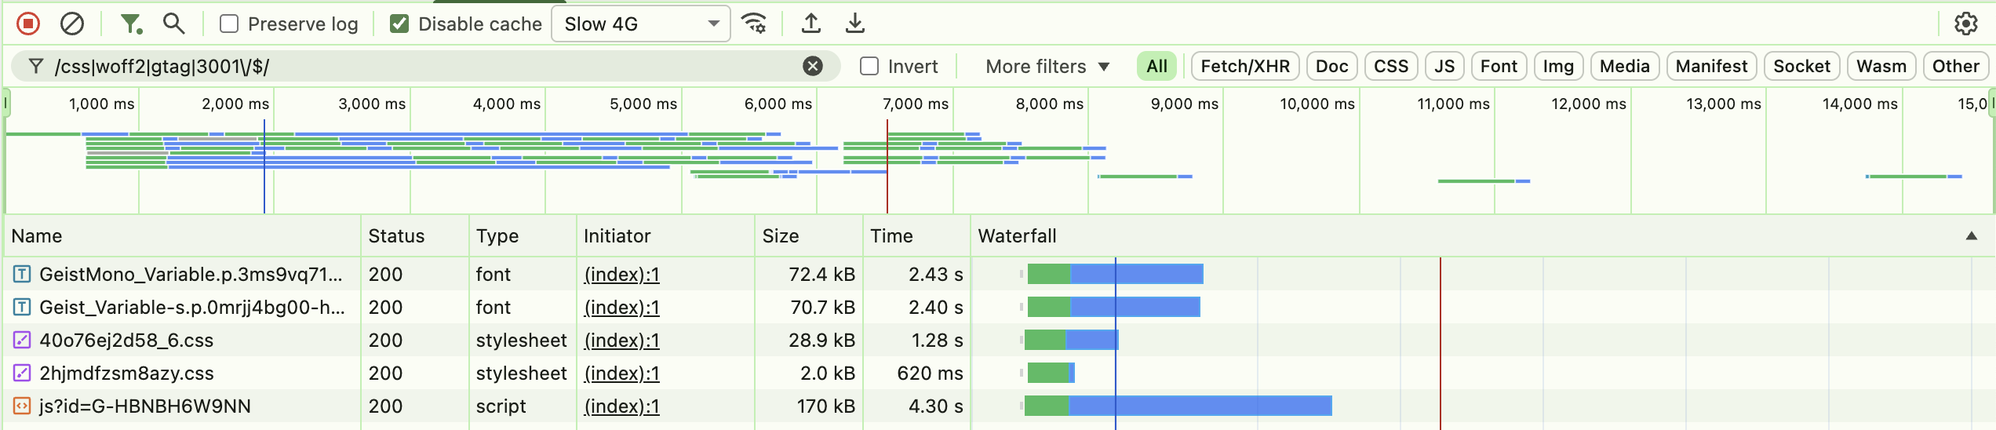
Look at the Initiator column: every row says (index), meaning every one of
these files was ordered up front by the document head. Two fonts at 70 KiB
each, a 170 KiB analytics script, and a 29 KiB stylesheet, all leaving the
starting line together. The stylesheet is the only one of the four that
render-blocks the page, and it is the one being starved: it took two full
seconds to arrive while the fat files ate the connection. On this profile the
page painted at 3.7s and LCP landed at 4.1s.
That waterfall is two separate bugs in one picture.
Bug one: preloads starving the thing that matters
The fonts were not blocking render. They already had font-display: swap, so
text paints in a fallback and swaps later. But both fonts were preloaded,
which tells the browser: fetch these now, at high priority. On a fat desktop
connection nobody notices. On Slow 4G, the preloads and the stylesheet fight
over the same pipe, and the stylesheet loses.
The mono font was the clear cut. Above the fold it renders a version badge and
a row of little chips. Nothing a visitor needs at high priority. But the
geist package hardcodes its localFont() call, so there is no option to
pass. The fix is to re-declare it against the same file the package ships:
const geistMono = localFont({
  src: '../node_modules/geist/dist/fonts/geist-mono/GeistMono-Variable.woff2',
  variable: '--font-geist-mono',
  weight: '100 900',
  preload: false,
});
Same font, same file, one attribute changed. The sans font keeps its preload because it renders the headline, which is the LCP element. Starving that would be trading one bug for another.
Then the surprise in the built HTML:
<link rel="preload" href="https://www.googletagmanager.com/gtag/js?id=..." as="script"/>next/script with strategy="afterInteractive" quietly emits a high-priority
preload. That is 165 KiB of analytics, more than twice both fonts combined,
racing my render-blocking CSS. One word fixes it: lazyOnload. Analytics now
waits until the page has settled. The tradeoff is real, a bounce inside the
first second might go uncounted, but PostHog still catches it, and I would
rather miscount a bounce than cause one.
Bug two, or so I thought: the regional cache
The TTFB theory looked airtight. This site runs on Cloudflare Workers through OpenNext, and every prerendered page was being read from R2 on each request. R2 is object storage that lives in one region. The Worker runs at the edge, next to the visitor. So a request served from Singapore pays a cross-region round trip to fetch HTML that was finalized at build time.
Reading the OpenNext source made it look even more obviously wrong for this
site. The R2 cache exists to support revalidation: revalidatePath,
revalidateTag, ISR. I grepped the app. Zero calls. All content here is MDX,
compiled at build time. We were paying a per-request regional round trip for a
capability we had never used once.
OpenNext ships an alternative that reads from Workers Static Assets instead,
edge-local, distributed with the Worker itself. Its set() is literally a
no-op with an underscore on the discarded argument. A read-only cache for a
site whose content only changes at build time. One import swapped:
export default defineCloudflareConfig({
  incrementalCache: staticAssetsIncrementalCache,
});
Clean theory. Verified preconditions. Shipped it.
The measurement that ruined my theory
After deploying, the preload fix showed up immediately. Same throttled profile, same filter:
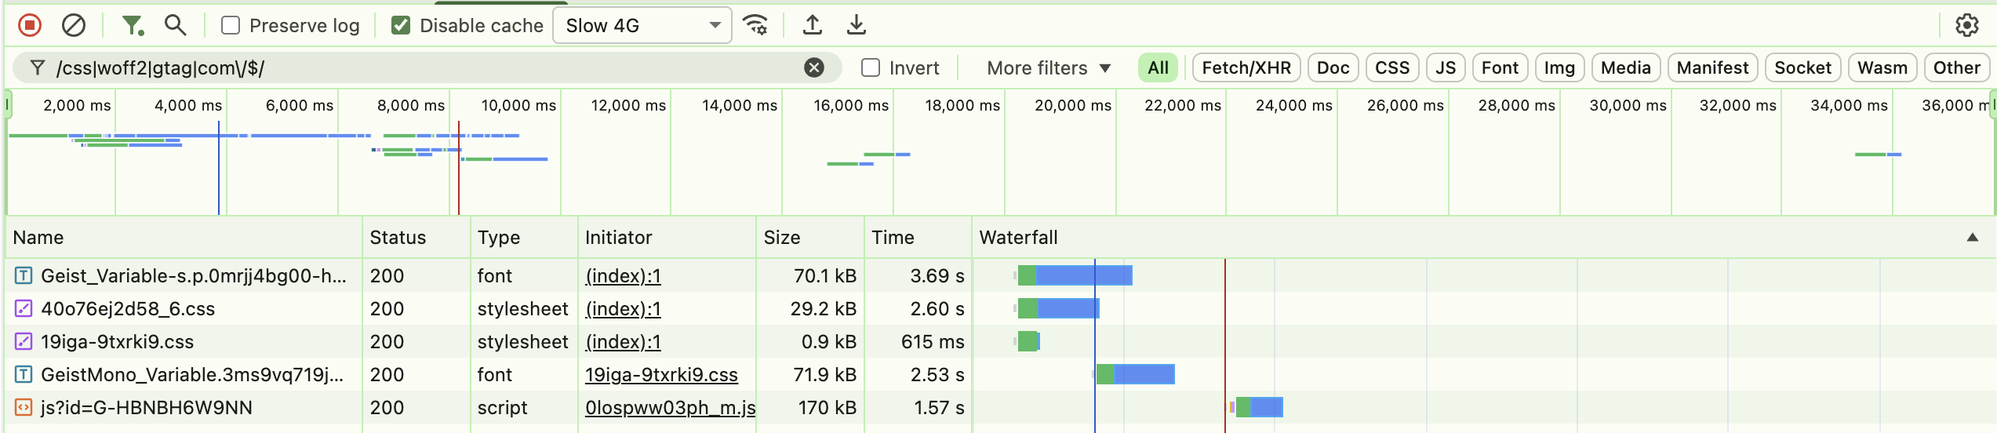
The Initiator column tells the story now. The mono font is initiated by the stylesheet, not the document head, so it starts politely after the CSS has finished. The analytics script is initiated by a lazy chunk and shows up last. Only the sans font still rides alongside the stylesheet, on purpose, because it paints the headline. On the throttled profile the CSS now lands around 2.2s instead of 3.7s, and LCP dropped from 4.1s to 2.3s.
Then I re-ran the TTFB check, eight requests back to back: 0.18, 0.20, 0.27, 1.14, 0.22, 1.15, 0.21, 0.19 seconds.
Not faster. Bimodal. Around 200ms, or around 1.1 seconds, nothing in between. The R2 swap had not moved the slow case at all, because the slow case was never R2.
It was cold starts. The Worker does not sit in memory waiting. When traffic goes quiet, Cloudflare evicts it. The next visitor pays for loading and parsing the whole Next.js bundle before a single byte comes back: about 900ms on this bundle. The visitor after that gets the warm instance and 200ms.
And here is the part that makes it hurt for a marketing site specifically: traffic is sparse. Visitors arrive minutes or hours apart. By the time the next one shows up, the Worker is asleep again. Nearly every real visitor lands on the slow side of that distribution. That is exactly why real-user TTFB sat at 1,402ms while my rapid-fire curl runs kept finding the fast path, and why that one 0.27s run in the very first measurement was quietly telling me the truth the whole time.
The cache swap stays, for what it is worth. It deletes two R2 bindings, a bucket read on every warm request, and a class of billable R2 operations. It is simpler and cheaper. It just was not the bottleneck, and if I had only measured once, on a warm instance, I would have written a very confident and very wrong blog post about how it was.
What actually fixes the cold start
You do not make a Next.js bundle parse in zero milliseconds. You stop needing it. Every page on this site is static, prerendered at build time. There is no reason a request for prerendered HTML should wake a JavaScript runtime at all. Cloudflare can serve it straight from the CDN cache and skip the Worker for cached hits, which makes cold starts irrelevant for pages.
That is a Cache Rule, and it is deliberately not shipped yet, because one of
the few dynamic routes on this site is /api/checkout, a GET that mints a
single-use payment session and redirects to it. Cache that by accident and
every buyer after the first gets redirected into someone else's checkout. A
cache rule that is one path-pattern too greedy turns a performance tweak into
a payments incident. So it ships with explicit exclusions, a purge-on-deploy
step, and a test that requests checkout twice and asserts the two sessions
differ. Measured, guarded, then enabled.
That Cache Rule is still unwritten today, and it is one of three things I call wrong about the Next.js stack this site runs on.
What I would tell past me
Synthetic tests and real-user data disagree in useful ways. My throttled runs found the bandwidth bug that RUM could never isolate; RUM found the cold-start pattern my warm curl runs kept missing. You need both, and when they disagree, the disagreement is usually the story.
Fixing is not the end of the task. Measuring after the fix is. One of my two fixes worked. The other taught me what the problem actually was. If the distribution of a metric is bimodal, the average is lying to you, and so is any single measurement.
And the fix I was proud of was not the fix that worked. It rarely is.